CLASS LIMITS
Number of variables which describes classes: the smaller number is the lower class limit and the larger number is the upper class limit.
CLASS BOUNDARIES
They are precise number which separate one class from another.
CLASS WIDTH OR INTERVAL
It is the difference between the class boundaries
FREQUENCY DISTRIBUTION
The organization of set of data in a table showing the distribution of the datainto classes or groups together with the number of observations in each class or group is called a frequency distribution
CUMULATIVE FREQUENCY DISTRIBUTION
The total frequency of a variable from its one end to a certain value called the base is known as the cumulative frequency distribution.
SIMPLE BARCHART
A simple bar chart consists of a horizontal or vertical bars of equal width and lengths proportional to the values they represent.
EXAMPLE: The following table shows the enrolment in a school. Illustrate the data with a simple bar chart.
- It can be drawn quickly
- The ratios of the bars are readily seems.
- Can also be used to show values of non numerical categories such as months, different brands etc.
Disadvantage
- One simple information can be shown
MULTIPLE BAR CHARTS
It shoes 2 or more characteristics corresponding to the values of a common variable in the form of grouped bars, whose lenghths are propotional to the values of the characteristics and each of which is shaded differently to aid identification.

Advantages
- This type of chart is useful when dealing with two or three categories
- Comparing categories with in days, a year and the categories b/w the years.
- By comparing the heights of the bars we are able to see not only the trend, but the difference between the sales of two items for each of the specific periods of time.
Disadvantage
- It is even more different to group readily the relation between two or three test of figures.
COMPONENT/COMPOUND BAR CHART
It is in which each bar is divided into two or more sections, propotional in size to the components parts of a total being displayed by each bar.
They are used to represent the cumulative of the various components of data and the percentages. They are also known as sub divided bars.
1. Sectional percentage bar chart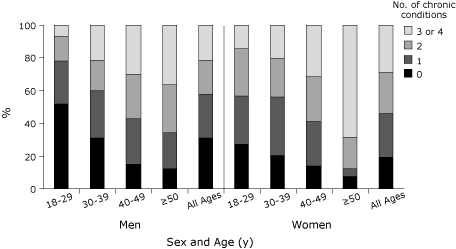
2. SubDivided BarChart

Advantages
- It is generally used to compare the budget of different families
Disadvantages
- It doesn’t show the actual amount
No comments:
Post a Comment